
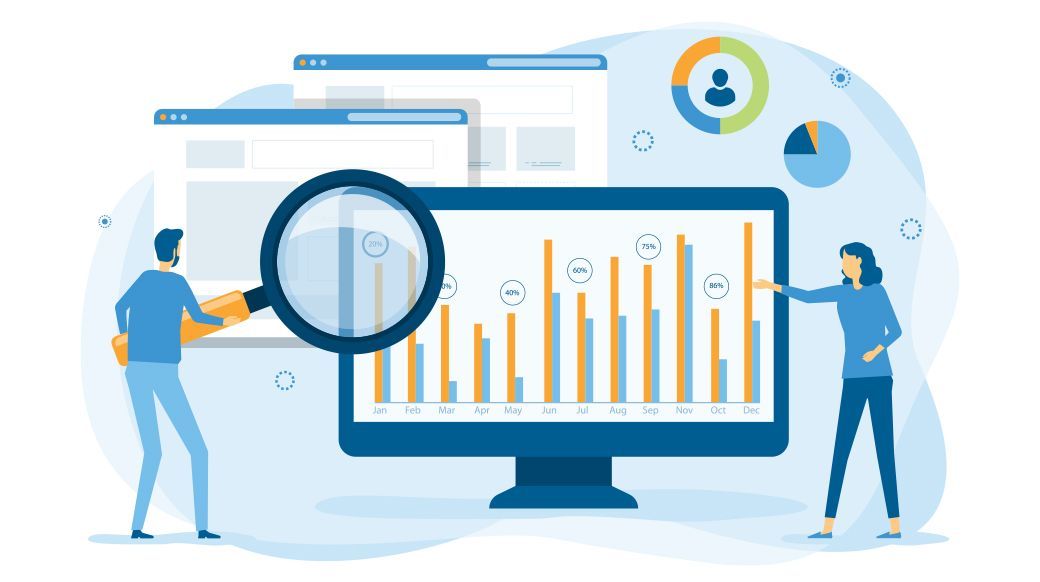
CU*BASE is the premiere ASAP (Ask See Act Profit) toolset that provides everything you need right at your fingertips. Use these dashboards to analyze and mine your data for opportunities, and then connect with members for new business.
Credit Report Data Mining Dashboard
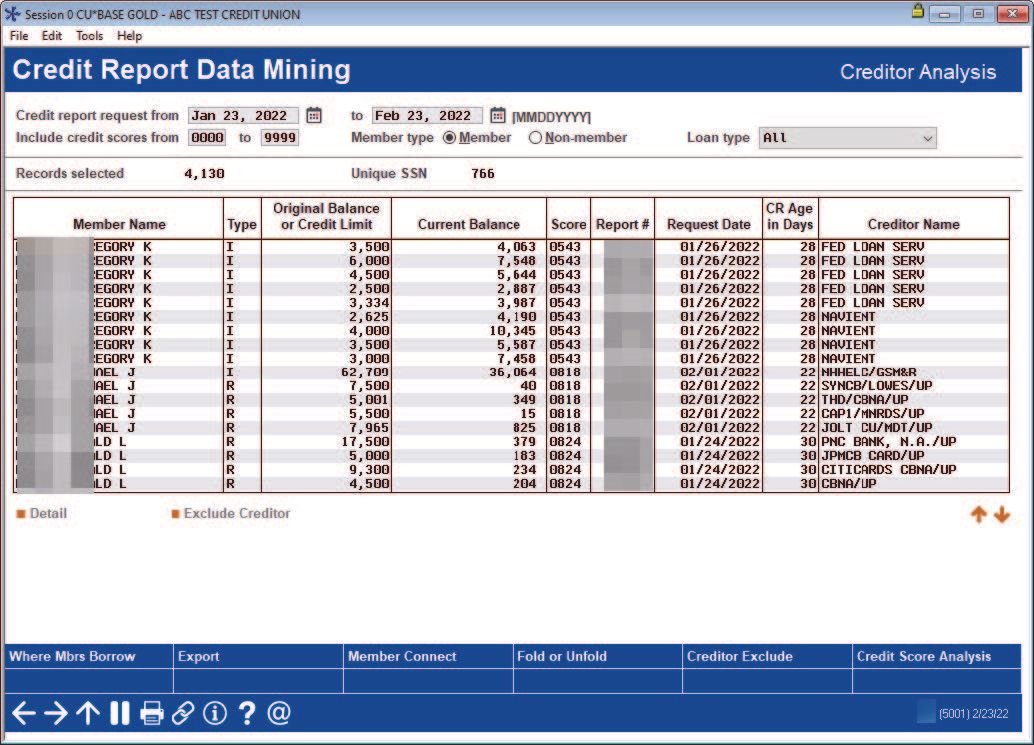
Use this dashboard to subdivide your credit bands into specific campaigns focused on actual products that members have elsewhere. Then, speak directly to Group A that is shopping for payment versus Group B that is looking for the best rate available. Act on this opportunity to understand your audience and make an offer.
What you can analyze with this dashboard:
The Credit Report Mining dashboard shows all credit scores for a member. These scores come from the Credit Score History file and include all scores pulled from all channels. Use this dashboard to see if multiple credit reports have been pulled on a given individual by a date range, and to see how these scores compare as part of a trending analysis.
How to access this dashboard:
Access this dashboard by selecting Tool #318: Credit Report Data Mining.
EFT Portfolio Dashboard
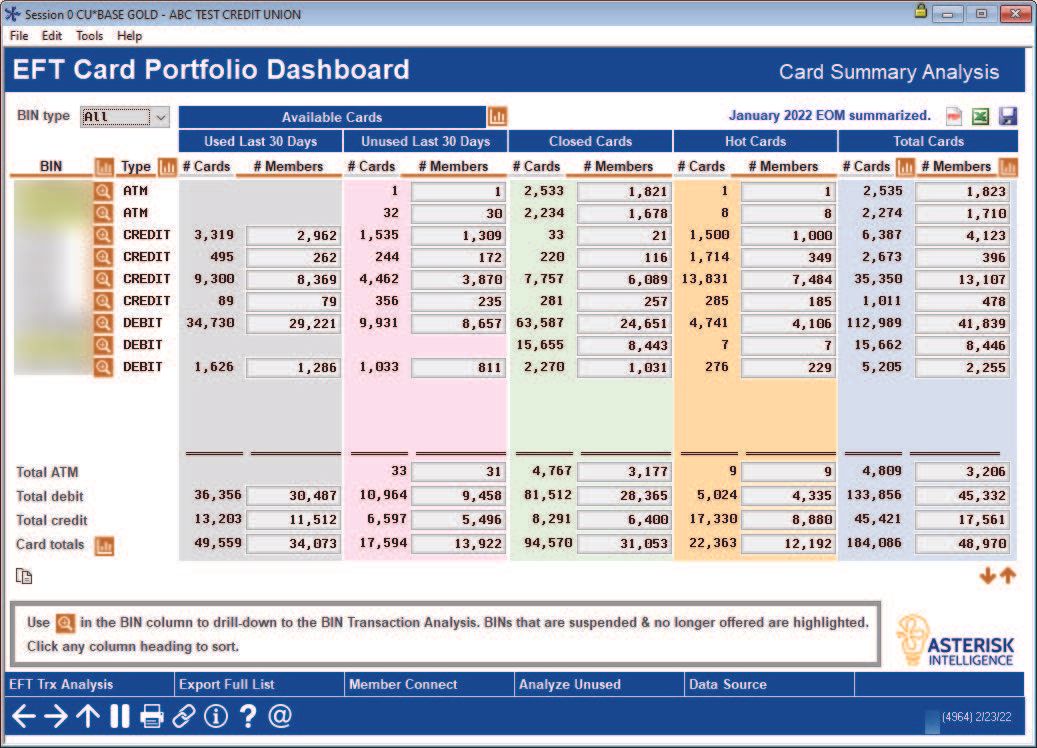
The number one reason to use the EFT dashboard is to identify unused ATM/debit and credit cards. Then, either make an offer or reduce risk by closing out cards. Also use this dashboard to review short-term unused cards to evaluate if you are “losing the love” of a member. Follow this with a “How do I keep you?” proposition.
What you can analyze with this dashboard:
This dashboard allows you to review statistics on your ATM, debit and credit card data. Data is available on the screen for cards used during the last month closed cards, hot cards, and total cards. From this screen you can view transaction analysis, analyze groups of members’ relationship to your credit union and view data on cards that have not been used in the previous thirty days.
How to access this dashboard:
Access this dashboard by selecting Tool #594: Portfolio Analysis - EFT Usage.
Loan Risk Score Analysis Dashboard
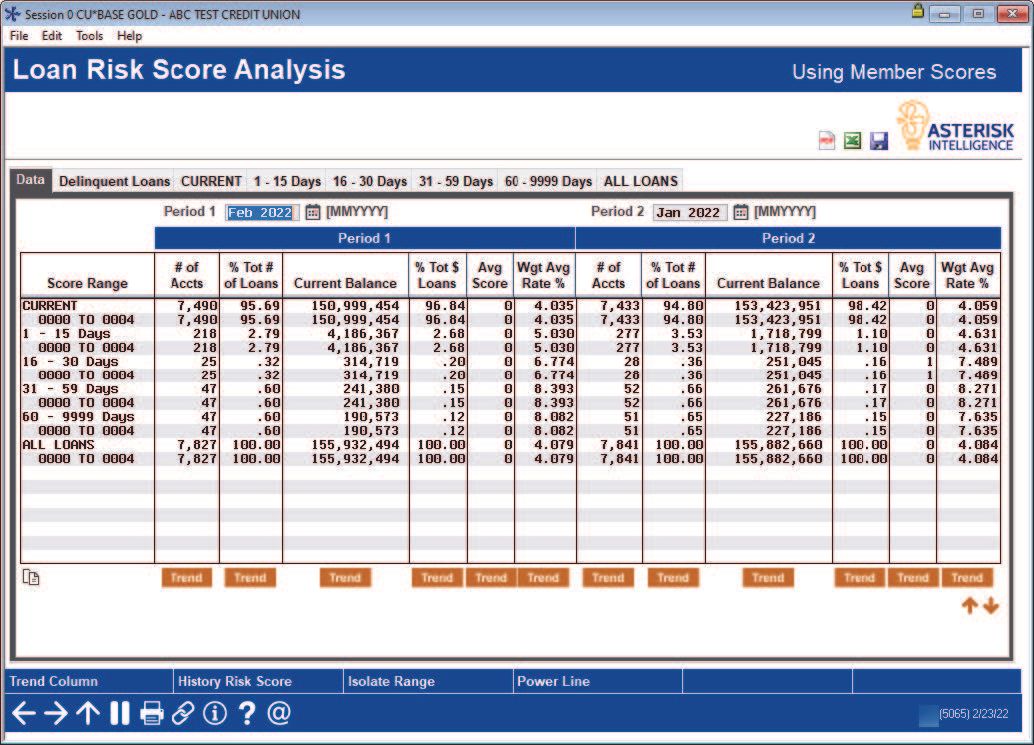
This dashboard gives you the ability to study and analyze risk bands in your risk portfolio and how they correlate historically to your portfolio performance. Take action. Study your unsecured versus secured loans. Then, adjust your risk-based pricing appropriately.
What you can analyze with this dashboard:
This dashboard is a must for anyone who currently uses risk-based pricing. Use it to compare the performance of your risk-based pricing with your loan performance. See if your risk matches your reimbursement. Do you need to adjust your credit score ranges or adjust your variance (the amount you add to the base rate for any risk-score range)? The real power is on the screen shown above, where you can data mine across a specific piece of information, such as current balance.
How to access this dashboard:
Access this dashboard by selecting Tool #473: Loan Risk Score Analysis.
Where Your Members Borrow Dashboard
With the push of a button, the dashboard ranks competitor financial institutions that are also doing business with your members (and their co-borrowers). Want a list of your top five mortgage competitors? This dashboard provides you with the data you need to understand your opportunity (total present balance) to get started. Then contact the members and make them an offer to move their mortgage over to a credit union product.
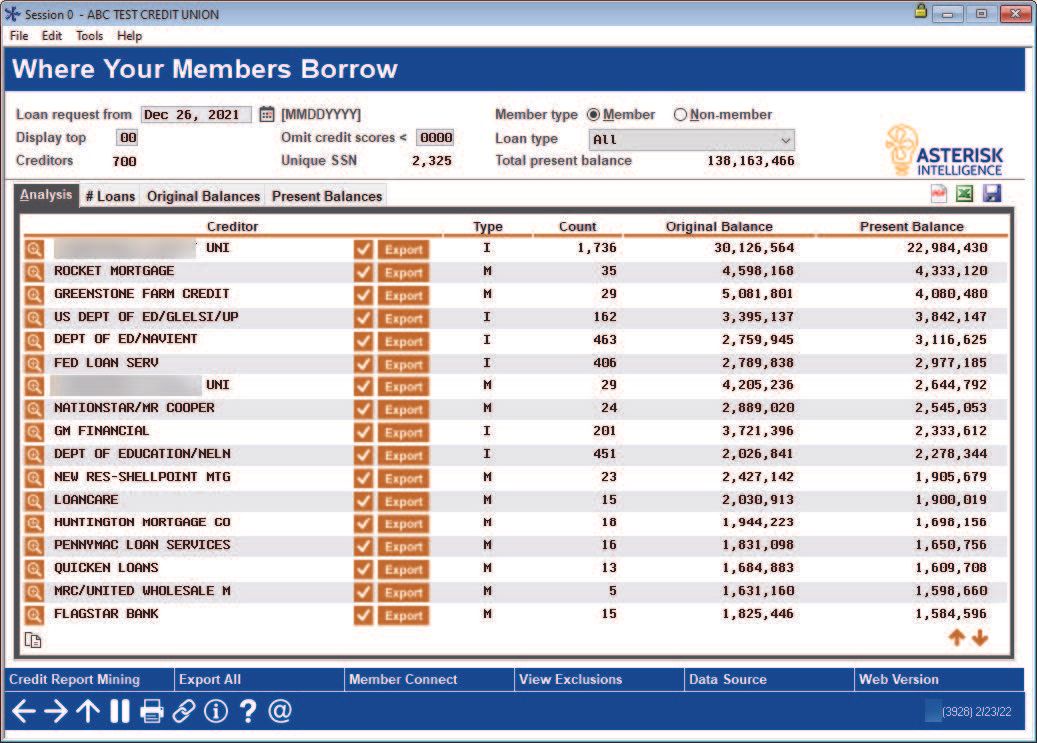
What you can analyze with this dashboard:
Every time a transaction is posted to your member accounts or a credit report is pulled, your members are telling you where they are doing business. Every time a person is a co-borrower on a loan, their credit report is pulled as well. This dashboard allows you to summarize what your members and their co-borrowers are telling you through credit reports stored on the CU*BASE system.
How to access this dashboard:
Access this dashboard by selecting Tool #976: Where Your Members Borrow.
All Accounts Analysis Dashboard
Start with measuring production in a given time window to view your new loans. From here, with just the click of a button, you can measure branch production, staff production and production by specific loan category. It is just that easy. And don’t forget to use the closed loans feature to identify loans that were closed in the time frame as well.
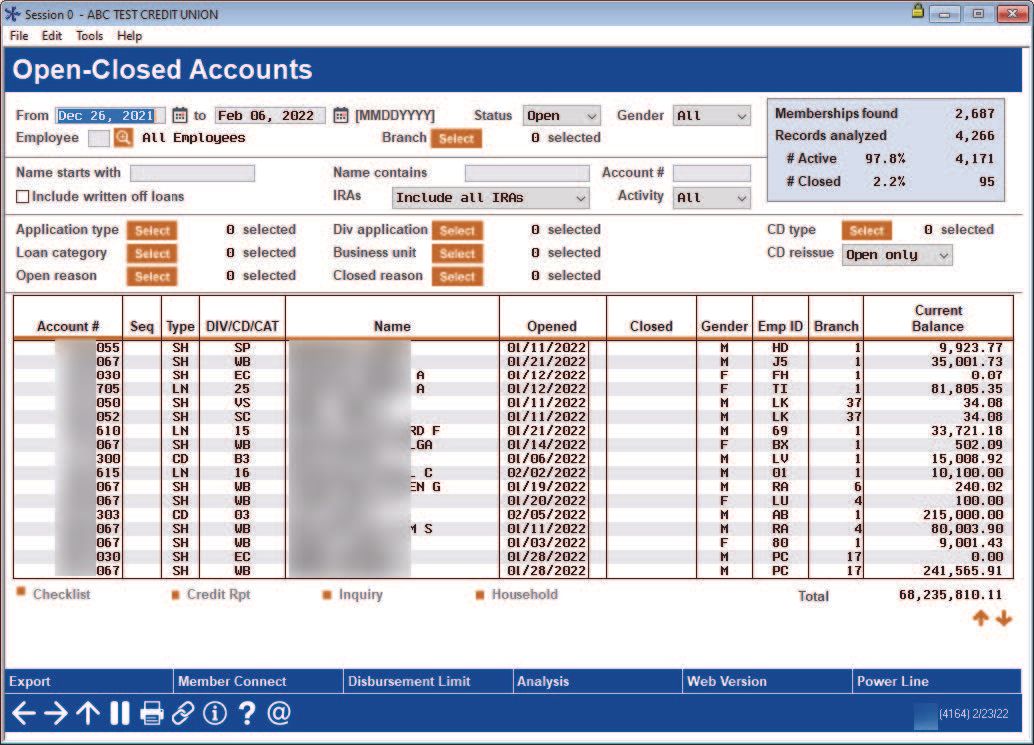
What you can analyze with this dashboard:
In addition to all of the data you see on the entry screen, you can drill down into the analysis tab which gives you 10 screens of information about the accounts and the members who own them, including the members’ products and services, balance amounts, eStatement enrollment and more.
How to access this dashboard:
Access this dashboard by selecting Tool #552: New/Close/All Accounts Dashboard.
Collections Dashboard Summary
This screen shows you a complete collections dashboard displaying your delinquency pipeline. View loans that are one day, one week or one month delinquent with additional columns showing loans that have been delinquent for a longer time, with breakdowns according to the NCUA time frame. This screen is a one-stop shop. No printing of reports or creation of special queries are needed. Simply select a date range, and the data is available for you.
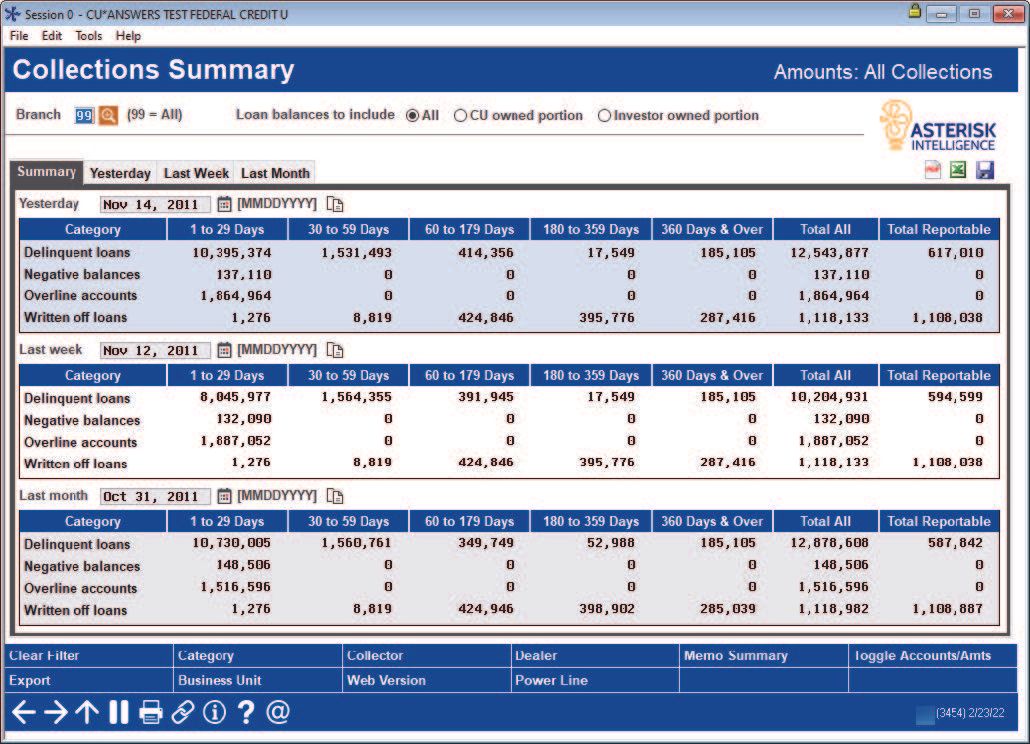
What you can analyze with this dashboard:
Work with this screen to monitor how your portfolio is at certain times of the month to see if progress has been made to pay down your delinquent loan portfolio. The strength of this screen lies in the fact that you can not only view the delinquent figures, but that you can also filter the data by several buttons. Filter by category, for example, to monitor your credit card or real estate portfolio.
How to access this dashboard:
Access this dashboard by selecting Tool #229: Collections Dashboard/Summary.
Concentration Risk - Collateral View
This is the Collateral Breakdown Analysis dashboard of the Concentration Risk Analysis Dashboard. Use this analysis to view the percentage of loans that have collateral. This aggregate view gives you an immediate insight into how many loans are backed by collateral and the average LTV percentage.
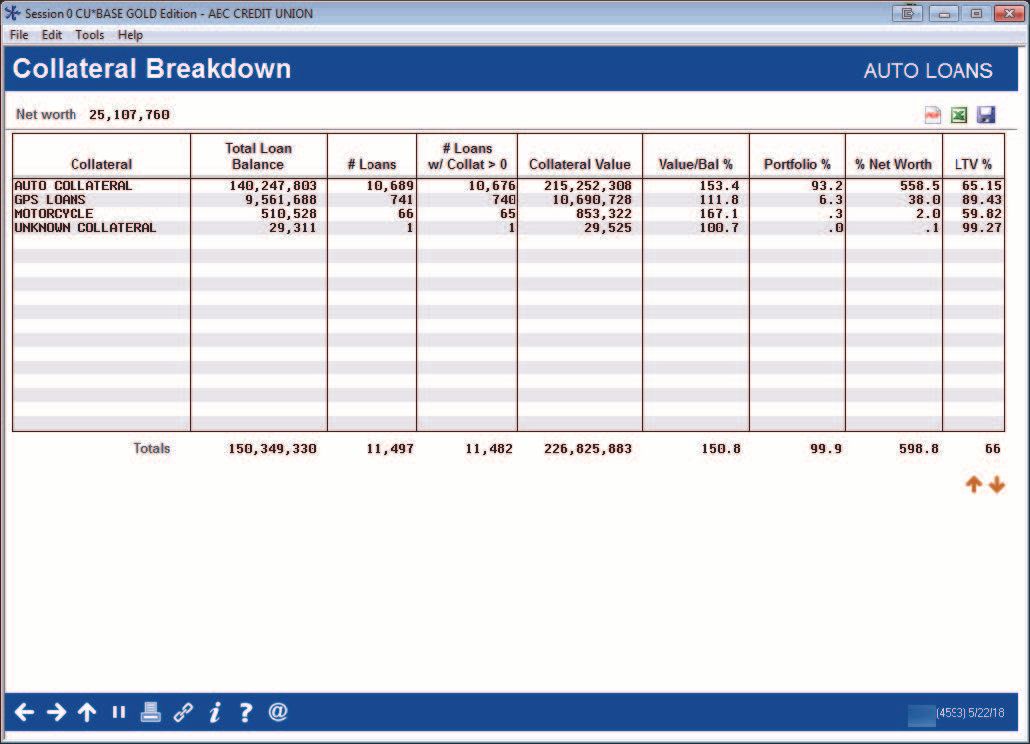
What you can analyze with this dashboard:
This screen lists statistics on the collateral associated with the loans included in the segment by collateral type. Also included are statistics on loans without collateral. Total figures are included at the bottom of the screen.
How to access this dashboard:
Access this report via Tool #592: Portfolio Analysis - Concentration Risk. Select to view the summary analysis and, from there, select the "Collateral View" button.
Credit Score Analysis Dashboard
Depending on who you are talking to at the credit union, you can use this dashboard as a carrot or a stick. If you are a marketer, use this dashboard to find members to whom you want to up the offer. If you are in collections, use this dashboard to identify individual members with poor credit scores to determine what action you might take.
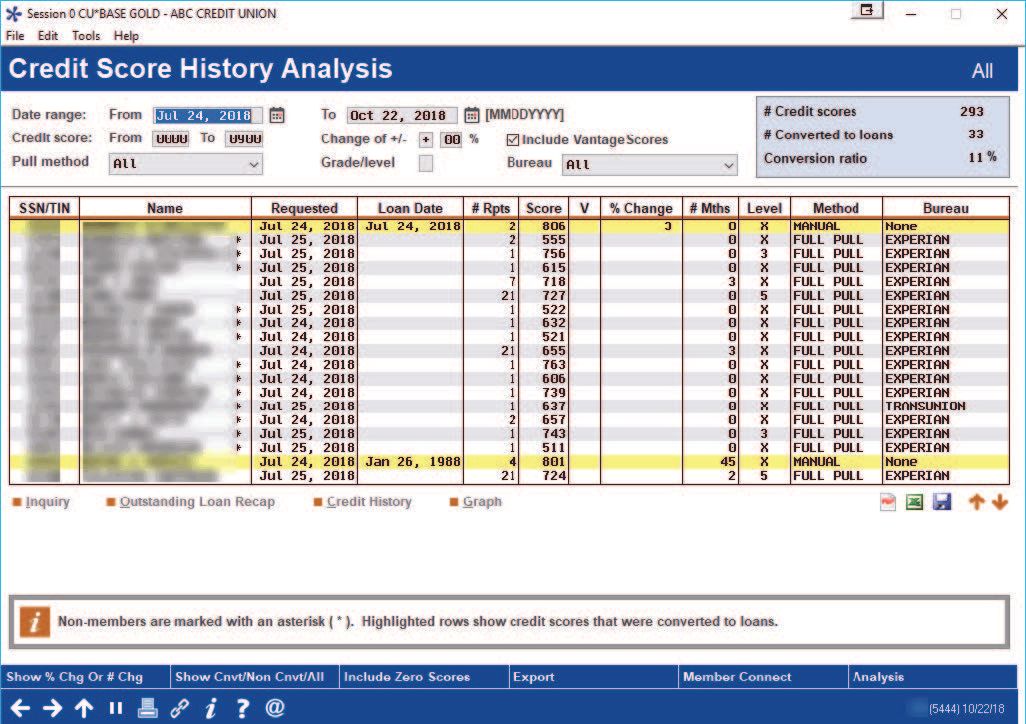
What you can analyze with this dashboard:
The Credit Score History dashboard allows you to analyze your entire credit report portfolio to see what percentage of your membership is improving their scores and what percentage is worsening their scores. Additionally, it gives you the opportunity to create a segment of the population and then contact them based on credit score history.
How to access this dashboard:
Access this dashboard by selecting Tool #319: Credit Score History Dashboard.
Contingent Liability Dashboard
This online dashboard inquiry for contingent liability is a trending tool for expanding opportunities and tracking loan disbursement progress. The inquiry quickly shows how the contingent balances are flowing from one month to the next. If you are looking to grow your loan balances, look at this screen. Your work is done. Talk to these members.
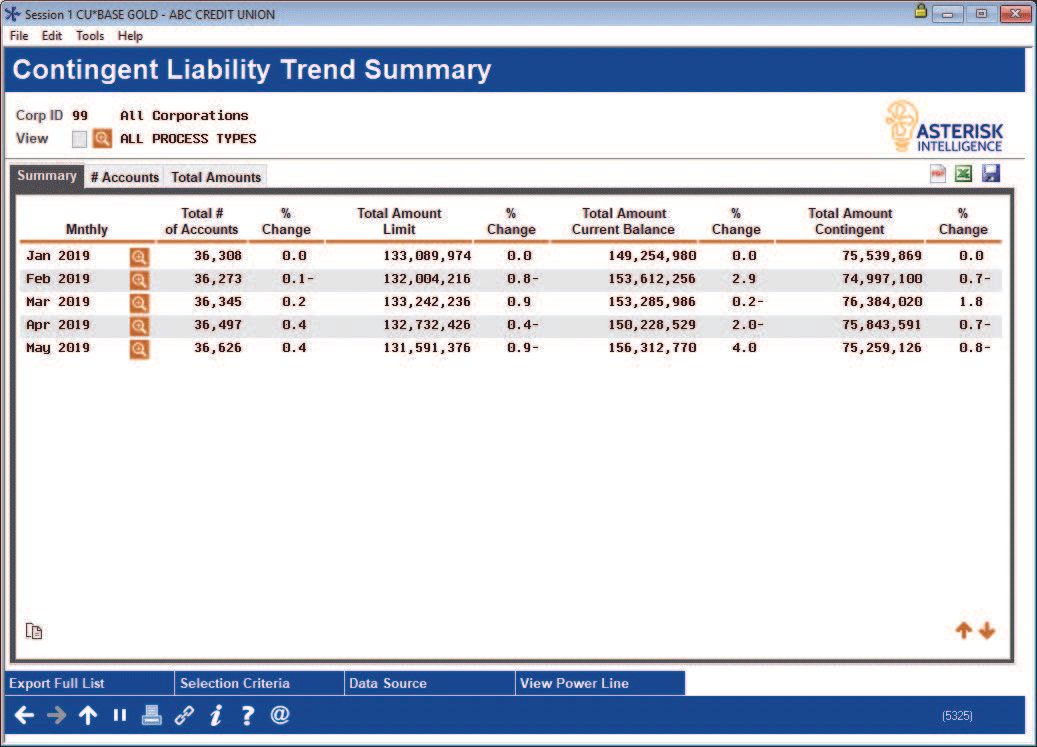
What you can analyze with this dashboard:
With this tool, you can quickly identify the areas where members are not utilizing their credit limits, and help teams formulate plans to get active on loan disbursements. If your team has made increasing loan balances one of its ongoing goals, this inquiry will track your progress when it comes to line-of-credit lending.
How to access this dashboard:
Access this dashboard by selecting Tool #281: Contingent Liability Trends Dashboard.
Loan Applications Statistics Dashboard
Have you ever wanted to know how many loan applications you have processed throughout the course of a year so that you could see trends, either downward or upward? Maybe you wanted to compare the volume of loan applications that were pending, denied or booked during a specific time period. Or maybe you wanted to break this information down even further, to see detailed information about a specific branch or member versus non-member activity. This dashboard has answers to all these questions.
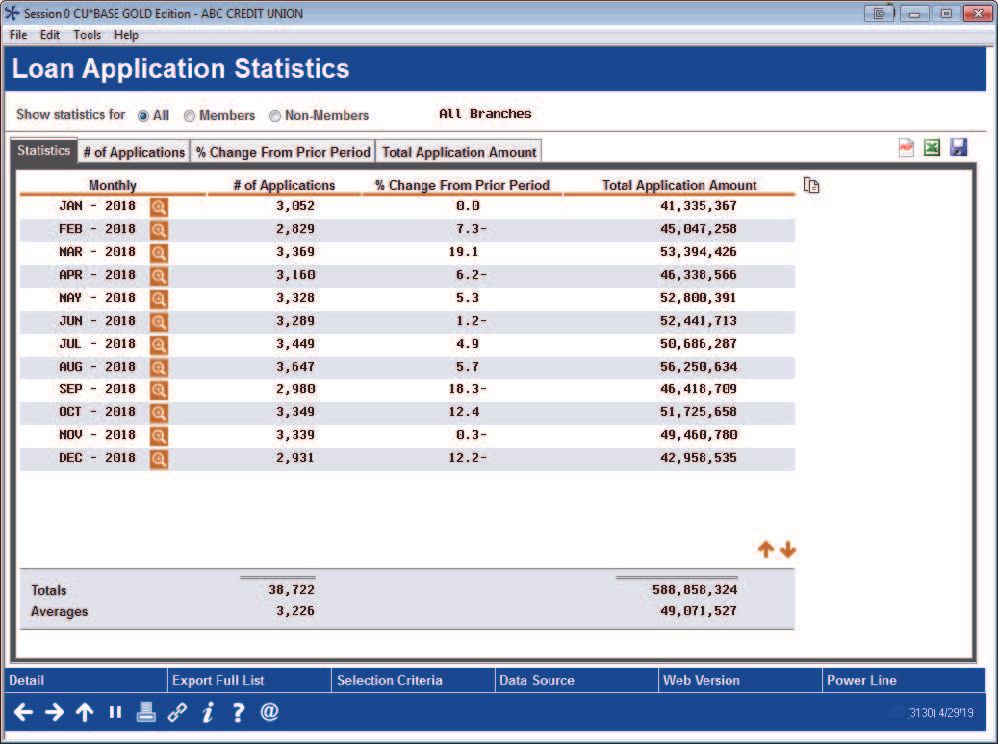
What you can analyze with this dashboard:
This tool, which includes several screens, displays this information, both in high-level and detailed views. View details of just one month or one quarter or view data over the course of a longer period. The tool breaks down the data by pending, denied and booked loan applications.
How to access this dashboard:
Access this report via Tool #455: Loan App Statistics Inquiry.
Concentration Risk Dashboard
The Concentration Risk Analysis is a powerful tool that can provide a wealth of information at the simple click of a button. You can quickly and easily stay informed about the risk concentration associated with different segments at your credit union.
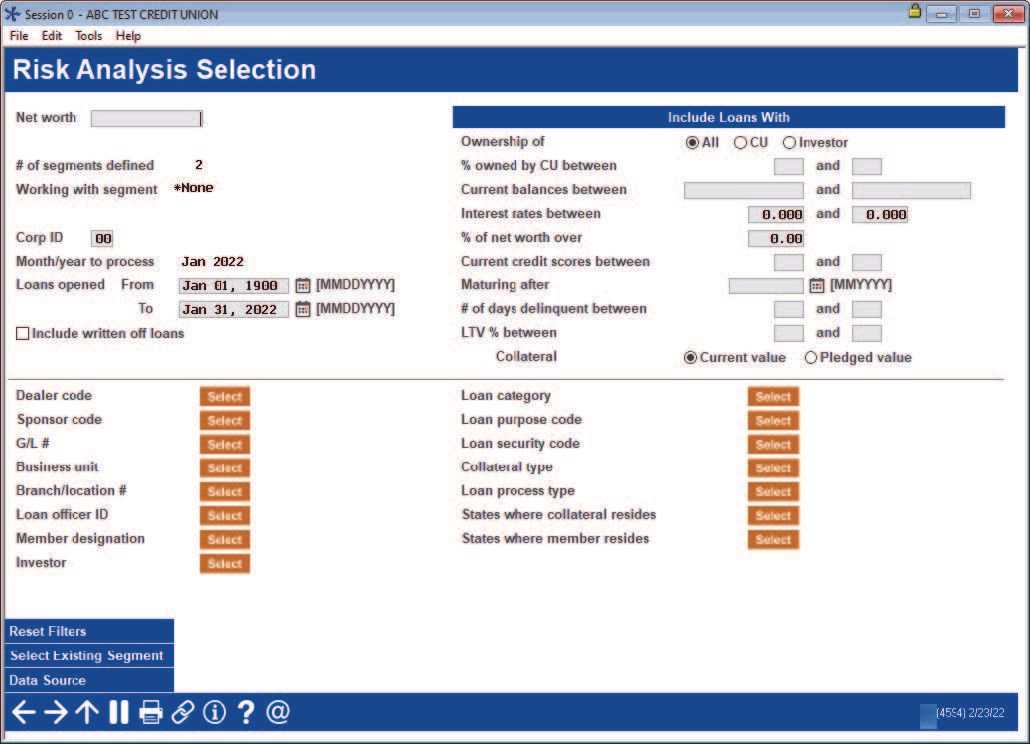
What you can analyze with this dashboard:
You can analyze concentrations at the member level by who owns the loan, how much your credit union has with a dealer and by loan category or purpose code, among other filter options available on the first screen. The summary tab will show some high-level information that can be very valuable regarding your loan portfolio such as number of loans, number of members, total balance, highs and lows of balance, credit score, payment and weighted average weight. You can drill down to each of the loans for additional details, or sort the fields however the credit union would wish.
How to access this dashboard:
Access this report via Tool #592: Portfolio Analysis - Concentration Risk.
Where Your Members Shop Dashboard
Find out where your members are shopping and spending their money. The ACH option can be a very powerful tool for marketing to members who have a loan elsewhere and/or are paying someone else. Additionally, you may find a local merchant that you could partner with to drive home the community spirit of the credit union industry.
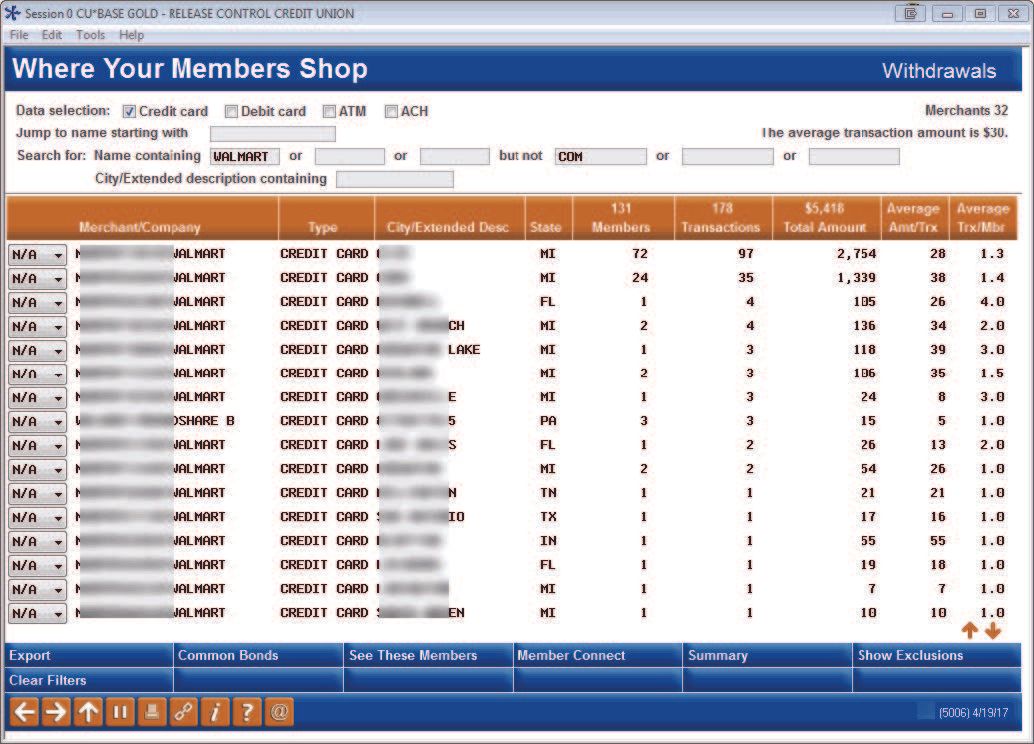
What you can analyze with this dashboard:
The ACH option gives the lender the opportunity to see what other financial institutions your members are paying. If the money is coming from your credit union, you are likely already their primary financial institution and have established trust with that individual. You can use the tool and find a list of members that represent refinance opportunities. You can use the ‘search for’ option to look for name of particular entities or exclude organizations such as your credit union.
How to access this dashboard:
Access this report via Tool #979: Where Your Members Shop.
Look to Book Ratio Analysis
Have you ever wondered how many loans you are approving and denying in each credit range or how long an application sits in a particular status? With this tool, you can answer not only those questions, but a host of others regarding your loan factory and get a firm grasp on what is going in and coming out.
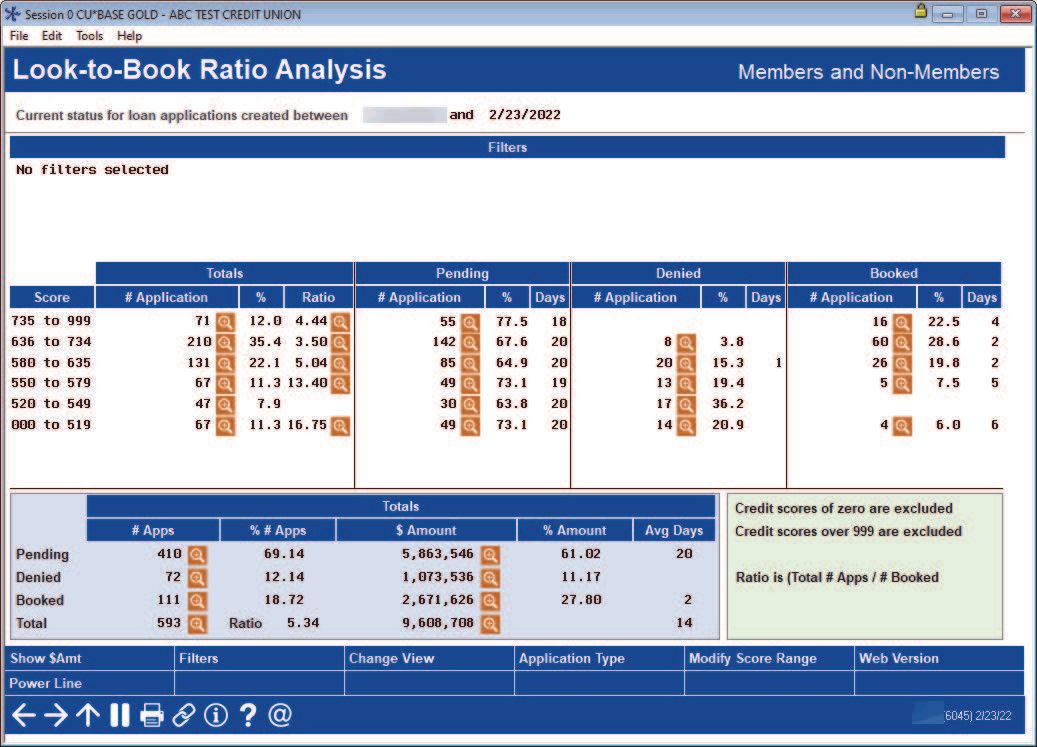
What you can analyze with this dashboard:
You’ve seen and, hopefully, used the activity tracking tool in the loan queue, but this allows you to really drill down into the data. When it comes to your booked loans, you can see how your approvals are distributed among your credit score bands and the average number of days it takes to book a loan. This will give you the information needed to evaluate your processes.
How to access this dashboard:
Access this report via Tool #484: Look to Book Ratio Analysis.
Provided by CU*Answers